
The Pain
It's 10:15 on a Tuesday morning. Two of your four bays are empty. One tech is leaning against the alignment rack scrolling his phone. Another is "prepping" a job that doesn't arrive until 2 PM. Your scheduler says the day is full — eight appointments booked — but two customers called to reschedule and one just no-showed.
Meanwhile, three walk-ins called in the last hour. You turned away two because the board looked packed. The third is getting an oil change at the shop down the street.
At the end of the month, you'll look at your car count and wonder where the revenue went. But the revenue didn't disappear — it leaked through the gaps between booked and actual. It leaked every time you turned away work because your schedule looked full when your bays were actually empty.
The Root Problem
Most scheduling systems treat appointments as blocks on a calendar. They don't account for the reality of a shop floor: no-show rates that run 10–15%, jobs that finish early, estimates that get declined, and walk-in opportunities that show up unpredictably.
The structural issue is lack of real-time visibility into actual bay utilization versus scheduled capacity. Your calendar says one thing. Your shop floor says another. And without data connecting the two, you're making staffing and scheduling decisions based on fiction.
This isn't a problem more techs can solve. It's a problem better data solves.
How AutoLeap Solves It
AutoLeap's Management Console gives you the data layer your scheduling system is missing. Instead of guessing at utilization, you can see it.
Car Count vs. Capacity Tracking
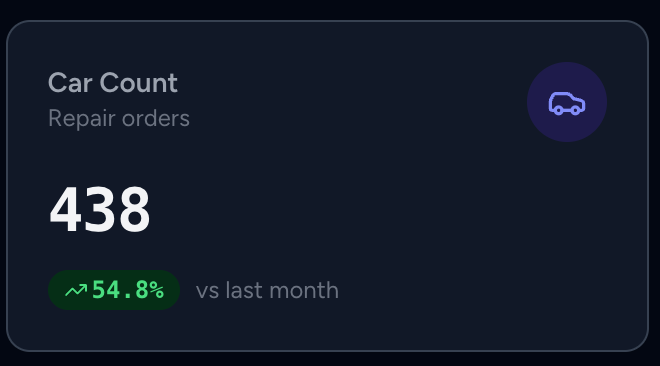
The dashboard's car count KPI tracks actual vehicles serviced — not appointments booked. Paired with the 12-month trend chart, you can spot patterns: which days consistently underperform, which months dip, and whether your car count is trending up or down against your bay capacity.
Location-Level Comparison
For multi-location operators, the location comparison bar chart ranks every shop by car count for the selected period. If one location is running at 85% utilization while another sits at 55%, you'll know within seconds — not at the end-of-month P&L review.
[SCREENSHOT: Location comparison bar chart showing 4 shops with car count bars, one location visibly lower than the others with a red indicator]
Year-Over-Year Accountability
The YoY comparison view shows rolling 18-month data so you can compare this March to last March. A shop that ran 420 cars last March and 370 this March has a problem — and now you can see it the moment it starts trending, not after the quarter closes.
Shops that track car count weekly and compare against prior year catch utilization problems an average of 6 weeks earlier than those relying on monthly P&L reviews.
[SCREENSHOT: Year-over-year comparison table showing monthly car count, sales, and average RO with green/red change indicators for each month]
Before and After
| Metric | Before AutoLeap | After AutoLeap |
|---|---|---|
| Scheduling visibility | Calendar-based (booked vs. slots) | Actual car count vs. capacity |
| Time to spot a dip | End of month (P&L review) | Same week (dashboard KPI) |
| Walk-in decision | Gut feel from looking at the board | Data-driven based on actual utilization |
| Revenue leaked to gaps | ~$2,000/month (10-bay shop estimate) | Reduced by 40–60% within 90 days |
The Result
When you can see the gap between your schedule and your shop floor, you stop making decisions based on a calendar that lies to you. You hold buffer slots for walk-ins because you know your no-show rate. You shift a tech between locations because you can see one shop trending 30% below target this week. You stop turning away revenue that's standing in your parking lot.
The bays were never the bottleneck. The blind spot was.